![]()
5 Market-Moving Events in 1H 2022 |
5 Events We Are Watching in 2H 2022 |
1. Commodities – Reading the Tea Leaves |
1. Inflation – Is Stabilization in Sight? |
2. It’s Getting Real – Real Rates |
2. Fed Reaction When Inflation Stabilizes |
3. How Low Can You Go? |
3. Credit and Preferred Stock Valuations |
4. Stock-Bond Correlation Déjà Vu |
4. Is It Finally Time for MBS to Shine? |
5. Liquidity – “Fast” or “Real” |
5. What We Are Watching in Credit Fundamentals? |
Bonus: China – Easing Against the Grain |
Welcome to the Smith Capital Investors 5X5. We explore topics from the first half of the year and issues facing us in the second half of 2022.
5 Market-Moving Events in 1H 2022
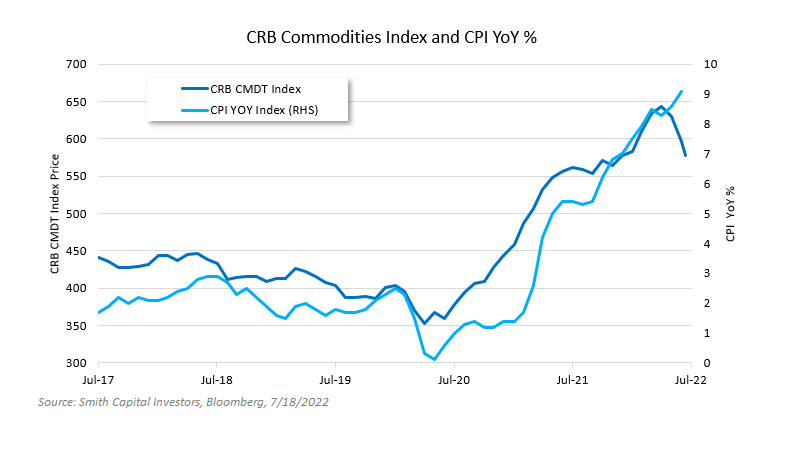
1. Commodities: Reading the Tea Leaves
We have seen high levels of volatility across asset classes this year and commodities are no exception. The CRB Commodities Index has round-tripped (-10% from the highs) and now sits unchanged on the year. This follows an 85% rally – trough to peak – from the April 2020 lows. Current fundamentals remain strong in most markets as demand continues to outstrip supply. However, in the face of a hot June CPI report (9.1% YoY), a relentlessly strong dollar (+11.6% YTD), tightening financial conditions, and fear of an impending recession, commodity prices are starting to deteriorate. We are watching commodities markets closely to understand the potential implications for inflation, corporations, and consumers.
- We view commodity prices as an important driver of the inflation narrative, particularly with food and energy making up 22.1% of CPI. For the Fed, successfully bringing down inflation will partially depend on driving commodity prices lower. This could prove difficult as several underlying factors have contributed to tight commodity markets. On the supply side, years of anemic returns during the prior decade led to structural underinvestment in the development of many key commodities. Despite higher recent prices and potential returns on investment, supply has generally been slow to come online due to regulatory or environmental hurdles, pandemic and geopolitical related supply chain issues, and labor force challenges. On the other side of the ledger, demand in many markets may have reset structurally higher due to societal factors like a growing middle class and emphasis on electrification and green technology. This dynamic seems to be evident in many individual commodity forward curves. For instance, although the WTI Crude futures curve is in backwardation, absolute price levels remain at elevated levels well into the future.
- In the face of increasing raw materials costs, corporations have largely been effective at passing through price increases to consumers, a fact that has contributed to record profit margins. If we are entering a period of weakening economic activity, corporations may be less effective at passing through further raw material inflation and could see margins contract. Furthermore, if commodity prices remain stubbornly high due to tight supply factors, corporate cost structures could be less variable in nature, leading to elevated corporate operating leverage and margin deterioration.
- With the successful corporate pricing initiatives mentioned above, commodity inflation has led to an increase in prices to consumers on a range of goods. J.P. Morgan estimates that, on average, consumer spending is up 35% YoY on gas and 6% on other non-discretionary categories. This is important because increases in the cost of staples like food and energy have the potential to crowd out discretionary spending. This dynamic is likely contributing to record low consumer sentiment, which could have broad reaching implications.
BOTTOM LINE
Understanding commodity market dynamics is likely to yield insights into corporate fundamentals and inflationary trends. At the current market juncture, we expect commodity price volatility to continue creating winners and losers at the individual corporate, sector, and macroeconomic levels.
INSTITUTIONAL INVESTOR USE ONLY
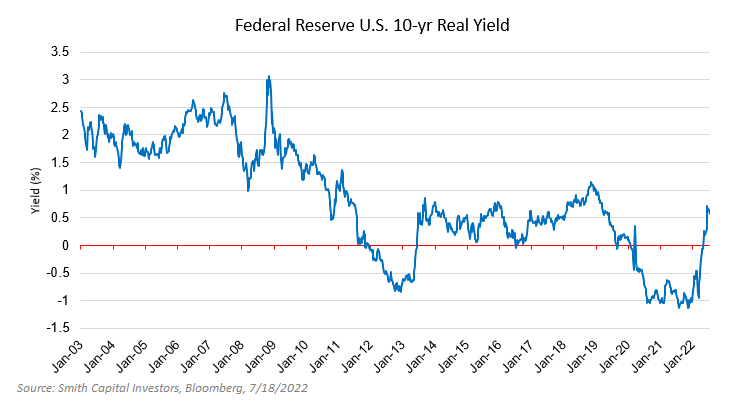
2. It’s Getting Real – Real Rates
As the Federal Reserve is tightening monetary policy to combat inflation, the adjustment in financial markets is finally pushing “real rates” from negative to positive.
- Throughout the pandemic “real rates”, also known as the inflation-adjusted rate, or for the consumer the purchasing power of one’s money, were negative. Negative real rates were stimulative for the market throughout the recession and recovery by pushing investors to take more risk.
- With the Fed turning from accommodative monetary policy in the pandemic to now aggressively fighting inflation, we are witnessing a market repricing across risk, including risk-free assets.
- The Fed’s intent is to slow the demand side of the equation to return inflation to their 2% mandate. By raising rates to combat inflation and slow growth, the adjustment in real rates has quickly impacted risk assets.
- This adjustment hasn’t been all bad – for one, the repricing is healthy for both stocks and bonds after a period of too much liquidity and risk taking in the system. Second, positive real rates suggest that the market believes the Fed will succeed at taming inflation. Finally, positive real rates will benefit savers as they are able to reduce their risk profile.
BOTTOM LINE
We are at the point in the pandemic-created cycle where policy normalization is warranted, and the Fed has turned from supporting the markets to tightening monetary policy. While the tightening has not been without volatility, we are encouraged by the return of positive real rates as a sign of normalization in the transmission mechanism. We will watch real rates as an indicator of the health of the economy or a warning sign that the Fed has tightened too far and is pushing the economy back into recession.
3. How Low Can You (Asset Valuations) Go?
As we enter the back half of 2022, it feels like investors are playing one big game of limbo. With each new piece of economic data pushing the limbo stick closer to a tangible bottom, the market is left asking – how low can asset valuations go? In response to record rate hikes, investors turned more defensive in nature causing asset valuations to plummet and leaving massive wealth destruction in its wake.
Looking out towards the back half of 2022, the probability of an economic downturn has spiked to nearly 50% according to Bloomberg polling, up from 30% in June and 20% in March. Hanging in the thralls of a looming recession, the next round of economic releases will play a markedly more significant role in shaping expectations, as seen last week when market consensus quickly pivoted back to a 75bps hike on better-than-expected long-term inflation readings. With the market now placing less than 30% odds on a 100bps rate hike, we consider several developing factors that suggest asset valuations have not yet reached their bottom:
- Signs of consumer pullback across pockets of the market and a steady decline in personal savings falling below pre-pandemic levels (~5% vs. 7-8%) are converging at the crux of an inventory buildup, pointing to an acceleration in corporate price erosion after several quarters of consecutive gains. An overly aggressive rate hike could drive valuations down further at the same time as management teams are forced to absorb a larger slice of inflationary pressures and profit margins are squeezed.
- Accelerating strength in the U.S. dollar may be a positive for consumers in a net-importing economy but could constrain U.S. corporate profit margins in the near-term. Last week we saw the U.S. Dollar trade at parity with the Euro for the first time in over 20 years, in addition to the U.S. Dollar Index already being up an impressive +11.6% YTD. Considering that an estimated 30% of U.S. corporate sales are generated abroad, foreign exchange translation could have more significant consequences on future earnings growth than in recent history.
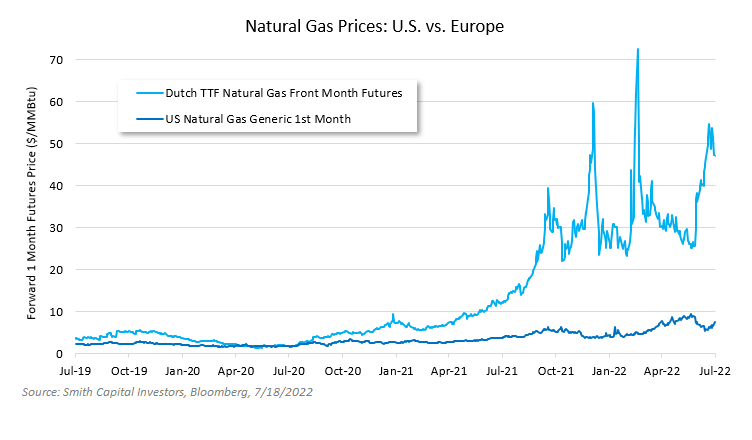
- Substantial spikes in energy costs have been a major contributor to the inflationary pressures corporations have faced since the onset of the pandemic. Interestingly, U.S. natural gas prices have shown increasingly lower correlation to European natural gas prices, suggesting spillover from the energy crisis abroad could be limited in the U.S. In addition, the magnitude of energy price increases may be less impactful on future consumer demand, with research published by RBC estimating that 5-6% of oil demand has been permanently eliminated as hybrid/remote work environments become more structural in nature. While still a huge unknown, energy prices may be less impactful on U.S. corporate valuations as we progress through the year.
BOTTOM LINE
Operating under the assumption that supply chains do not fully recover until mid-FY23, investors are left wondering how impactful monetary policy will be on effectively limiting supply-side inflation amid slowing growth concerns. As we enter the second quarter of earnings, understanding the stickiness of prior pricing gains, exposure to international markets, and clarity around changing supply and demand dynamics related to energy are just a few of the many factors that will play a crucial role in assessing how much farther this limbo game can go before market valuations fully bottom out.
INSTITUTIONAL INVESTOR USE ONLY
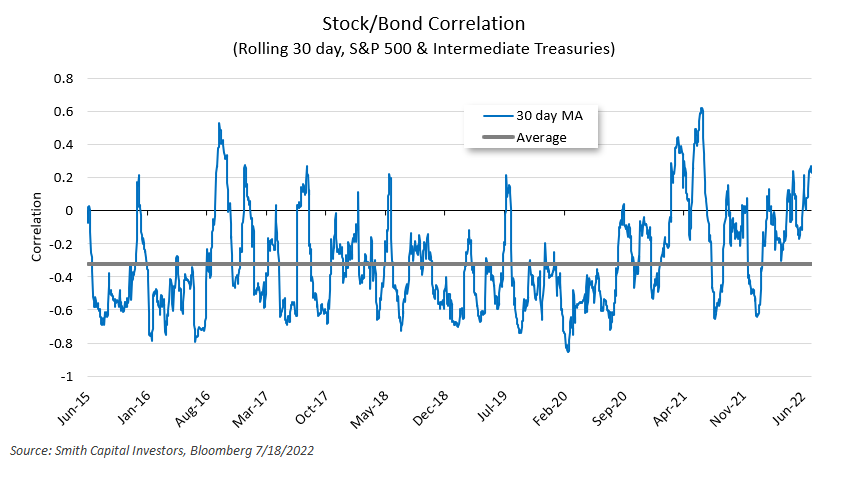
4. Stock-Bond Correlation Déjà Vu – Inflation forces both asset classes in the same direction… again
Last year, we wrote about the positive stock-bond correlation that began in the first quarter of 2021, driven by the Fed’s injection of liquidity into an economy wrestling with pressures caused by the pandemic. This was a flip from the typically negative correlation that has existed since the late 1990s, driven by the flight-to-quality characteristics of bonds.
In mid-to late-2021, there was a brief period where correlations felt a bit more ‘normal’ with the rolling 30-day stock-bond correlation averaging -0.27 in the second half of 2021. Fast-forward one year to the first quarter of 2022, when the Fed began removing that liquidity by raising interest rates and signaling balance sheet reductions, stocks and bonds moved together yet again, but to the downside.
- Similar to the rate selloff in the second half of 2016 (and the more recent rate selloff of 1Q21), Treasury yields moved sharply higher in the first quarter of 2022, and as they did, the stock-bond correlation turned positive again. As CPI prints continued to heat up through the end of 2021, inflation talk began to dominate markets and the prospect of quicker-than-expected hikes from the Fed drove rates higher across the curve. At the same time, the narrative that the Fed would be unable to control inflation and would force the U.S. economy into a recession caused equities to sell off and credit spreads to widen. The result was the worst first half of a year since 1970 for equities, and the worst first half on record (since 1900) for bonds – a swift rise in rates coupled with sharply wider credit spreads spelled a large magnitude of negative total returns for bondholders.
- This reminds us of the pain that is felt across asset classes when the Fed removes liquidity and cheap capital from markets. Easy monetary policy and zero-bound rates were a tailwind for equities during 2020 and through much of the last 20 years, but the prospect of slowing growth coupled with a rise in the cost of capital creates a path of least resistance that is lower for risk assets as equity investors discount cash flows at higher rates.
- As the U.S. economy searches for the ceiling on inflation and thus a ‘top’ for rates and ‘bottom’ for equities, stock-bond correlations could remain in a different correlation regime than investors have experienced over the last 20 years, as the removal of liquidity or Quantitative Tightening is a new dynamic for the market.
BOTTOM LINE
Stock-bond correlations have flipped from negative to positive for the second time in 18 months, but the inputs to the broader equation make this time different. Low confidence in the Fed’s ability to control runaway inflation was quickly priced into rates, while fears around an inevitable recession forced a sharp sell-off in risk assets, resulting in wider credit spreads and lower equity prices. We continue to stress that watching the correlation and relationships between bonds and stocks is critical today.
5. Liquidity – “Fast” or “Real”
An age-old method of classifying groups often starts, “There are two types of people…”. Well in that vein, let us highlight an important distinction that Wall Street often references as it relates to types of investors in the bond market – Real Money (RM) and Fast Money (FM). While the titles indicate specific attributes of clients (pension fund vs. hedge fund, unlevered vs. levered, investor vs. trader), the underlying assumption is that RM invests for longer-term trends while FM takes advantage of smaller, shorter-term opportunities. We will leave the debate to others over what is considered “smart” vs. “dumb” money, but we can suggest that RM and FM actions influence liquidity in the fixed income market.
- In a market that, like others, can be traded from both the long and short side, the lens for viewing investor behavior matters to market makers. If a hedge fund is willing to express a view by selling bonds they do not own, it reflects a short term-ism that brokers cannot ignore. However, in our experience, dealers react with greater and larger conviction to the trades being put on by RM accounts that are willing to ride out market fluctuations without fear of a margin call.
- Broker-dealers, the de facto providers of fixed income market liquidity, rely on investor queues for technical aspects of their market function, notably in bid/ask spreads, quoted vs. executable levels, quoted vs. executable sizes, and accommodation to risk-taking behavior. This is most certainly not a stock market listed exchange.
- In 2022, we have noted a change in dealer liquidity impacted by a complex matrix of factors – flows into and out of fixed income funds, a reduction in supply, and a change in the interest rate environment…inter alia. The result has been a shift in credibility allotted to RM investors – they have increasingly become the accounts that brokers look to for signaling, whereas FM is the investor type that either forces dealer balance sheets offsides or provides inefficient information around the market direction.
BOTTOM LINE
The net result is, in our opinion, the marginalization of the FM account that has become less able to take advantage of market fluctuations due to wider bid/ask spreads and the frequency of which dealers “fall down” on their quoted levels and sizes. This is not a comment on dealer credibility. In fact, they are behaving as they should to higher volatility and lower quality of information. For us, this adds another tool to our process and a benefit based upon how we are classified as a counterparty.
INSTITUTIONAL INVESTOR USE ONLY
5 Potentially Market-Moving Events We Are Watching in 2H 2022
1. Inflation – Is Stabilization in Sight?
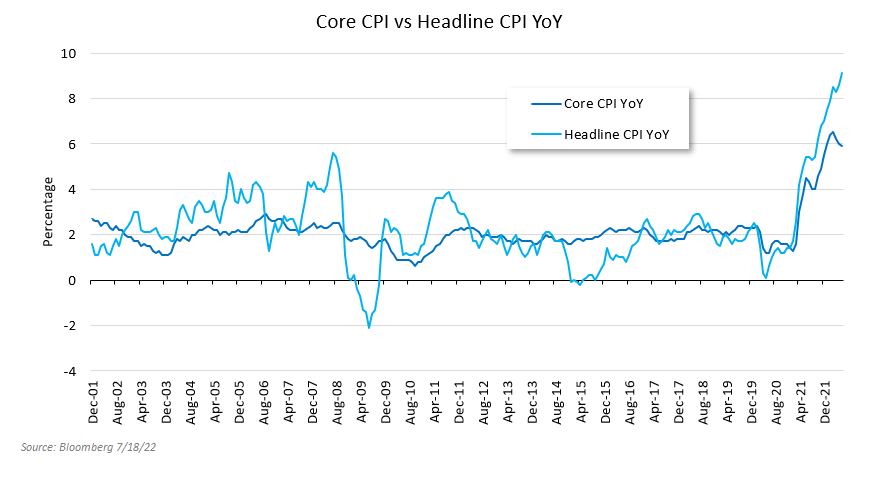
Inflation is once again moving higher – and broadening in scope – after what briefly looked like a peak from the Consumer Price Index.
- Headline CPI marked 9.1% YoY in June while Core CPI marked 5.9% YoY. Unfortunately, both food and energy prices lifted the headline further while Services helped keep the overall Core reading elevated. Owners Equivalent Rent, approximately 1/3 of Core CPI, is up 5.5% YoY. Though we are seeing the initial signs of easing in both home prices and rents, this will take time to be reflected in the data series.
- To make matters worse in the next few months, the positive impact from the “base effect” reverses due to low monthly numbers in July and August 2021, potentially elevating the Core numbers further.
- Post the June inflation report, we believe we are likely to end the year above 6% YoY on Core CPI. We expect inflation to step down in 2023 and move back towards the Fed’s 2% target in 2024.
- The Fed has stated that it will aggressively fight inflation via slowing demand, even to the point of pushing the U.S. back into a recession. Given the outright levels of inflation, the market expects the Fed Funds Rate to reach 3.5% by the end of the year.
BOTTOM LINE
We expect continued market volatility and repricing as the Fed moves to aggressively fight inflation via slowing demand. That being said, the transmission mechanism for slowing demand/growth and thus inflation will take time to flow through the data.
2. Fed Reaction When Inflation Stabilizes
Following the COVID-19 pandemic, the Federal Reserve purchased securities to support the economy, more than doubling its holdings from ~$4.2trn in March 2020 to ~$9trn in April 2022. The process was known as Quantitative Easing (QE). Now, with the tight labor market and elevated inflation, the Fed announced it will begin reducing its balance sheet – known as Quantitative Tightening (QT) – in June by letting its security holdings run-off at maturity, up to a certain cap.
- The last quantitative tightening was during 2017 when the Fed wanted to normalize the expansionary monetary policy affected during the global financial crisis. By the time the Fed started QT, the Fed Funds rate was at 1.75% and the balance sheet sat at ~$4.5trn, or ~23% of GDP. This runoff was completed in August of 2019 in combination with a cut to the Fed Funds Rate to support continued economic expansion. The balance sheet reached a low of $3.8trn, or ~18% of GDP.
- While this cycle is different – specifically Core PCE was 1.5% YoY in August of 2017, compared to 4.7% YoY in May 2022. The Unemployment Rate was 4.4% compared to 3.6% currently – the Fed’s intent with tightening policy is to slow demand. Slowing demand may send the economy back into recession, in which case, the Fed will be unable to hike rates back to the terminal level or return the balance sheet back to pre-crisis levels.
- As a reminder, the Fed was unable to return the balance sheet to pre-crisis levels in the last tightening cycle. The Fed also reminded us that they will maintain holdings at levels that keep reserve balances “ample,” which will allow them to adapt to changing market conditions as needed in the future.
BOTTOM LINE
In a world where inflation eventually stabilizes due to slowing demand, the Fed will turn its attention back to economic expansion and will adjust its policies accordingly to support the second part of the “dual mandate” — maximum employment. We will utilize Powell’s playbook from the last cycle as our guidepost and we believe that the Powell-led Fed will adjust policy, possibly even the size of the balance sheet, as necessary to support economic price stability and maximum employment.
INSTITUTIONAL INVESTOR USE ONLY
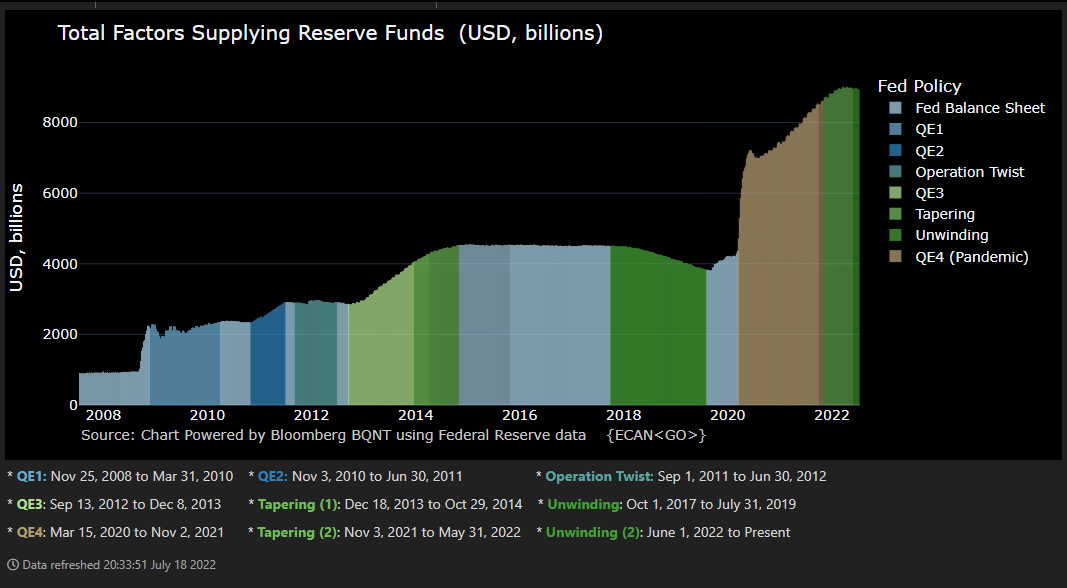
Source: Bloomberg, Federal Reserve 7/18/22
3. Credit and Preferred Stock Valuations – Where Are We Now?
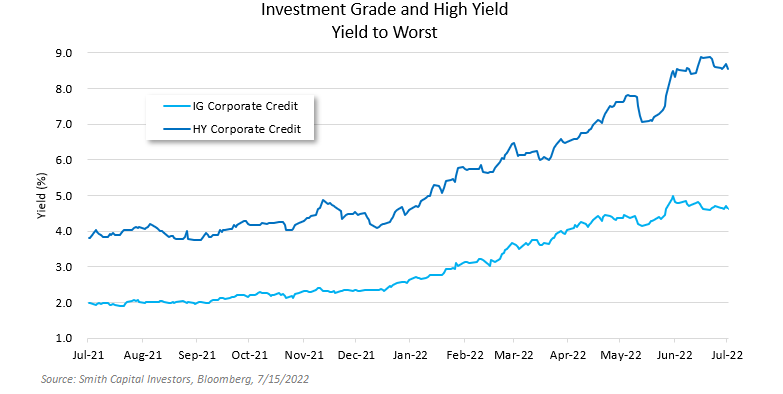
Credit markets have had a historically bad start to the year, with the Bloomberg U.S. Corporate Bond Index (“IG Index”) and Bloomberg U.S. Corporate High Yield Bond Index (“HY Index) returning -13.46% and -12.77%, respectively, YTD. Preferred stocks have fared even worse, with various index and ETF returns ranging from -15% to -25%. Earlier in the year, returns were primarily driven by interest rate duration, which could be seen by the underperformance of long-dated credit and the outperformance of lower-rated credit. With reinforced resolve from the Fed to do whatever it takes to tame inflation, the market has started to price in a higher probability of recession and credit stress. Consistent with a traditional risk-off stance, higher rated credit has outperformed riskier/lower-rated credit during this second phase of the selloff with the IG Index outperforming the HY Index by 334bps over the past three months.
- Following poor YTD performance, valuations are looking more attractive on a historical basis. Relative to the last 10 years of data, option-adjusted spreads (OAS) on the IG Index and HY Index sit in the 84th percentile (100 being the widest). However, while current spreads are wider than recent non-recessionary periods, historically spreads have gone much wider than current levels during recessions. Looking at yields, the Yield to Worst (YTW) on the IG and HY Indices is currently in the 99th and 97th percentile, respectively, relative to the last 10 years.
- On a Last Twelve Months (LTM) basis, the U.S. HY default rate was just 0.8%, well below the 25-year average of 3.0%. That said, current pricing is implying the default rate will likely increase, with the number of bonds trading at spreads greater than 1,000bps growing considerably and now representing 10.4% of the market. While the rate may increase, we think that defaults are unlikely to become elevated relative to historical averages, mainly due to the lack of a catalyst. Following the massive refinancing wave over the past couple of years, the potential bankruptcy trigger from a failure to refinance near-dated maturities is relatively low, with the number of bonds coming due in 2022-2024 representing only 8% of the total outstanding.
- Preferred stock returns have not only been hit by the rising interest rate environment, as referenced previously, but also by the recent risk selloff on recession fears. Since coming out of the Global Financial Crisis, preferred stocks have traded in a rough yield range of 4-6%. In 2021, preferred stocks moved to an extreme low end of this range; with average yields in the mid 3% area. After this year’s selloff, average yields are now in the low 6% range – a much more attractive entry point versus the historical valuation range. Additionally, while recession fears remain front and center the preferred universe is concentrated in large cap banking issuers. These issuers have solidified their balance sheets and increased the resiliency of their liquidity profiles over the last decade, potentially reducing the economic impact of a recession on the underlying credit quality of these issuers.
BOTTOM LINE
While we are cautious about the potential for further economic slowdown and volatility, we are seeing value in the credit markets on a name-by-name basis. At current yield levels, we find ourselves taking comfort in the “math behind the market” driving a higher probability of favorable returns going forward. For instance, with the current coupon yield on the HY Index at 6.6%, many bonds can absorb significant future spread widening/price declines before generating a negative total return. Furthermore, with an average HY Index dollar price of 87.03 and maturity of 5.92 years, convexity in the market is relatively high, and absent a default, the “pull to par” should provide downside protection.
4. Is It Finally Time for MBS to Shine?
After a rough start to the year for MBS from a performance perspective, many pundits have turned positive on the space, raising underweights to neutral or even overweight. We acknowledge that the risk-adjusted return profile of the space looks better following the sell-off over the previous several months, however, we think the outlook is more nuanced than most would admit.
- Agency MBS had excess returns of -163 bps for the first half of 2022 as the OAS of the Bloomberg U.S. MBS Index (MBS Index) widened by almost 20 bps to 46bps. This compared to a long-term historical average in the 40-60 bp range. The move back in OAS towards historical averages is probably the most positive factor for the outlook of the asset class.
- During the first half of 2022, the MBS Index exhibited extreme negative convexity, dramatically extending in duration while interest rates moved higher. The MBS Index duration climbed to all-time highs of ~5.9 years during the beginning of 2022. This increase in duration magnified the underperformance of the asset class during the interest rate sell-off.
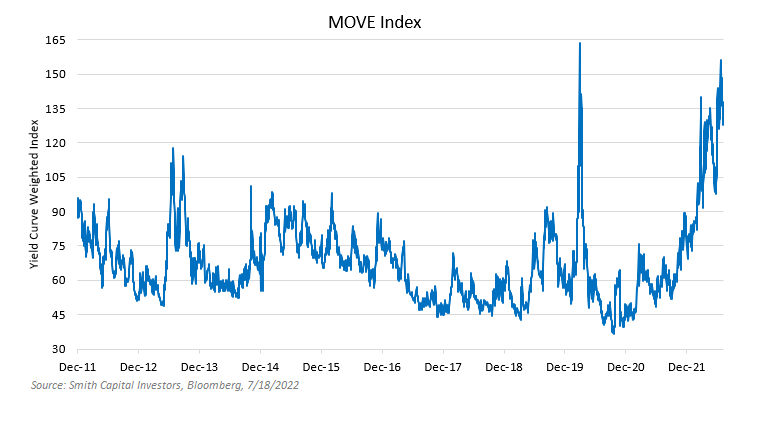
- Generically, mortgages perform better in times of lower interest rate volatility. However, volatility continues to remain elevated acting as another headwind for the asset class. The ICE/Bank of America MOVE Index which tracks U.S Treasury implied volatilities is near a 10-year high, eclipsed only by the spike during the pandemic in 2Q20.
- The biggest wildcard facing MBS for the second half of the year is the impact of the Fed’s balance sheet reduction program. The Fed concluded reinvesting paydowns in MBS last month and the impact of this Quantitative Tightening will only increase over time.
BOTTOM LINE
Through the first half of 2022, we have gotten more constructive on our outlook for MBS performance, however, we still lag the consensus bullishness for the asset class. While valuations have normalized, they remain at the lower end of the “normal” range. Extension risk in MBS is largely priced in, however, this only amplifies the risk of mortgages shortening in duration in the event of a large rally in interest rates. Additionally, with interest rate volatility seemingly set to be elevated until there is more clarity on the ultimate path of the Fed hiking cycle and easing inflation, we don’t believe the coast is clear for MBS. Finally, and probably most importantly for us, the age-old adage of “Don’t fight the Fed” plays loudly with the continued headwind from the Fed’s reduction of MBS holdings. In the interim, our incrementally more positive outlook for MBS means we have been gradually taking advantage of opportunities in the market to increase our exposure.
INSTITUTIONAL INVESTOR USE ONLY
5. What We Are Watching in Credit Fundamentals
During the upcoming 2Q22 earnings season we will be looking for key insights into how companies and management teams are handling pressures from record inflation, a strengthening dollar, a hawkish Fed, and continued disruptions in supply chains. Of particular interest will be insights into the trajectory of corporate margins and how management teams are shifting capital allocation priorities in response to a potential macroeconomic slowdown. We will also be interested to see how quickly rating agencies react to potentially deteriorating fundamentals.
- One factor that has recently contributed to corporate resiliency is historically high margin profiles. That said, higher input prices from wages and raw materials are likely to cause margins to take a material hit this quarter, as expectations for profit margins for the S&P 500 as a whole are expected to drop to 13.1% from 13.9% a year ago. The margin impacts from inflation vary widely from sector to sector, with energy propping up estimates on expectations of margins doubling YoY. Excluding the impact of this sector, net income margins are expected to drop to 12.9% from 14.4%. Companies looking to preserve margins could do so through cost reduction initiatives – which may include layoffs as already seen across multiple sectors. Heading into a potential recession, companies with high operating leverage could be at risk.
- As animal spirits lifted coming out of the pandemic, the defensive capital allocation framework adopted by many companies shifted toward investment in growth and shareholder returns. Now that the Fed is focused on slowing demand to fight inflation and access to ultra-cheap capital is a thing of the past, we will be closely monitoring how capital allocation priorities shift in the face of decreased fundamental strength. Whether or not management teams shift their priorities towards debt paydown, liquidity build, or share buybacks will directly impact the resiliency of the business in a potentially prolonged downturn.
- Coming out of the pandemic, credit has benefitted from a rating agency upgrade cycle. During 1Q22 we saw upgrade/downgrade ratios of 1.88, 2.57, and 1.05 for S&P, Moody’s, and Fitch, respectively. However, this trend has slowed in Q2 and with the probability of a recession increasing, we could see the start of a rating agency downgrade cycle. A downgrade cycle could have multiple implications – further pressure on the cost of capital, supply pressure in the high yield market from fallen angels, or incremental capital requirements and less favorable vendor terms. The leveraged loan market could be particularly affected given higher overall leverage levels, a recent expansion of single-B rated loans, and a CLO buyer base that is sensitive to credit ratings.
BOTTOM LINE
We are likely entering a period of deteriorating fundamentals in corporate credit. Corporates, for the most part, are set up well to withstand a slowdown given high balance sheet resiliency and elevated margins. In periods of rapid change, management teams can have an outsized impact on value creation or destruction. We aim to be aligned with management teams that are realistic about updating earnings outlooks, that shift capital allocation towards optionality and flexibility in periods of uncertainty, and that prioritize communication with investors and long-term thinking.
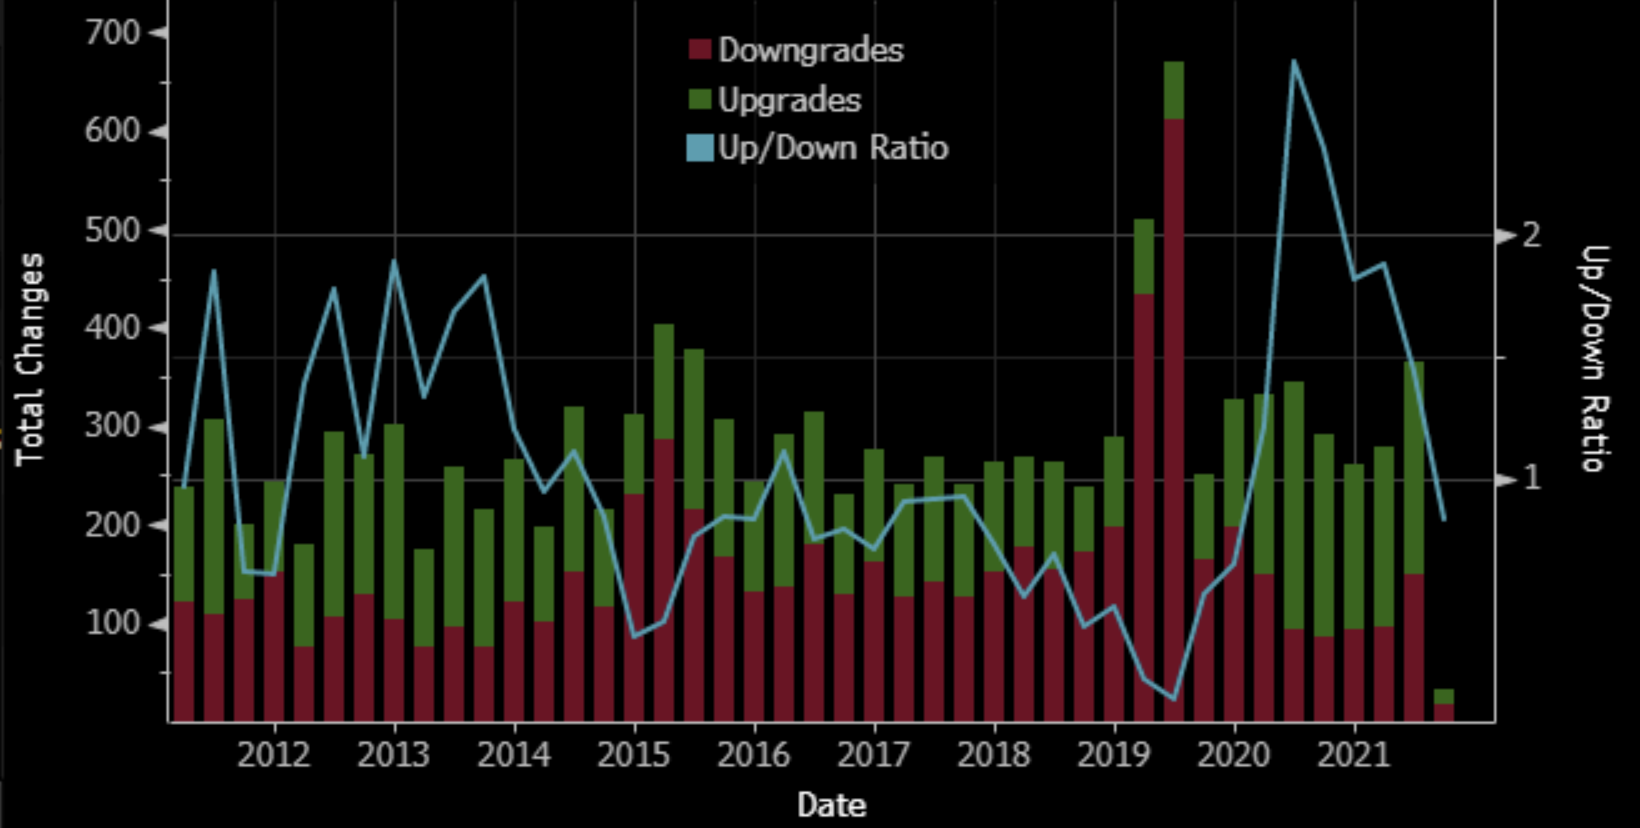 Standard and Poor’s Rating Changes
Source: Bloomberg 7/14/22
Bonus: China – Easing Against the Grain
2022 has seen over 60 central banks hike rates this year. China, however, is going against the grain. They have been easing since the fourth quarter of 2021 and are in the process of accelerating infrastructure spending to shore up the country’s economy. They have a 2022 growth target of 5.5% and will be hard pressed to achieve this following a weak 2Q22 GDP print of 0.4%.
- China’s zero covid policy remains a headwind for the economy. 2Q22 saw localized lockdowns throughout the months of April and May, which continues to add volatility to global supply chains. Cases are on the rise yet again. The persistence of the zero covid policy will remain a headwind for the global economy.
- China’s manufacturing and services indices have recently made their way out of contraction printing 50.2 and 54.5 for the month of June, respectively. This was the first report for both indices in expansion (>50) since February. Notice the correlation between months of contraction, weak 2Q22 GDP, and lockdowns.
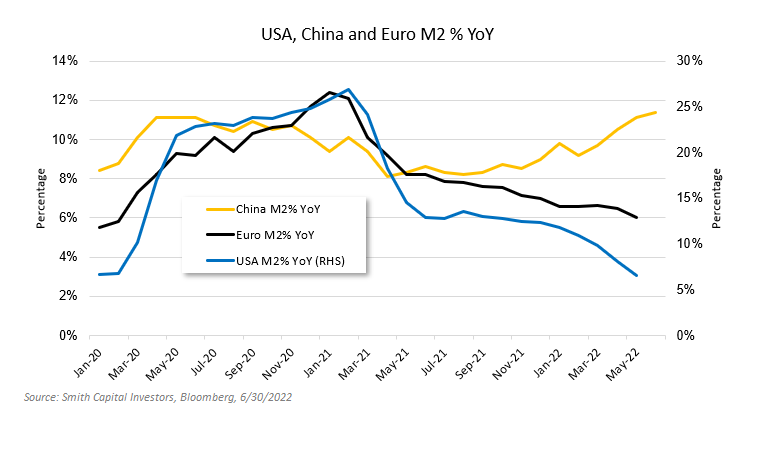
- Inflation levels in China remain modestly below the PBOC’s 3% target rate, with the most recent print coming in at 2.5%. Not fighting the inflationary battle seen in other parts of the developed world provides the PBOC and the Chinese government plenty of slack for easing and stimulus measures. On the latter, the central government has already allocated 3.65tn Yuan ($548bn) in special purpose bonds (SPBs) – aimed at infrastructure spending – for 2022 and is mulling another 1.5tn Yuan ($220bn) issuance this year.
BOTTOM LINE
China’s role in the global economy remains critically important contributing roughly 19% to global GDP. The divergence in monetary policy for the world’s second largest economy only adds complexity to the global flow of capital as Chinese markets will be receiving fiscal and monetary support while other markets continue repricing as financial conditions tighten and liquidity gets removed. We expect more volatility ahead.
INSTITUTIONAL INVESTOR USE ONLY
Let’s Talk – Smith Capital Investors
Our mailing address is:
Smith Capital Investors
1430 Blake Street
Denver, CO 80202
303-597-5555
833-577-6484
info@smithcapitalinvestors.com
www.smithcapitalinvestors.com
The opinions and views expressed are as of the date published and are subject to change without notice of any kind and may no longer be true after any date indicated. Information presented herein is for discussion and illustrative purposes only and should not be used or construed as financial, legal, or tax advice, and is not a recommendation or an offer or solicitation to buy, sell or hold any security, investment strategy, or market sector. No forecasts can be guaranteed, and the author and Smith Capital Investors assume no duty to and do not undertake to update forward-looking predictions or statements. Forward-looking predictions or statements are subject to numerous assumptions, risks, and uncertainties, which change over time. Actual results could differ materially from those anticipated in forward-looking predictions or statements.
Any investment or management recommendation in this document is not meant to be impartial investment advice or advice in a fiduciary capacity and is not tailored to the investment needs of any specific individual or category of individuals. Opinions and examples are meant as an illustration of broader themes, are not an indication of trading intent, and are subject to changes at any time due to changes in the market or economic conditions. The information presented herein has been developed internally or obtained from sources believed to be reliable; however, neither the author nor Smith Capital Investors guarantees that the information supplied is accurate, complete, or timely, nor are there any warranties with regards to the results obtained from its use. It is not intended to indicate or imply that any illustration/example mentioned is now or was ever held in any portfolio.
Past performance is no guarantee of future results. As with any investment, there is a risk of loss. Investing in a bond market is subject to risks, including market, interest rate, issuer, credit, inflation, default, and liquidity risk. The bond market is volatile. The value of most bonds and bond strategies are impacted by changes in interest rates. The return of principal is not guaranteed, and prices may decline if an issuer fails to make timely payments or its credit strength weakens. High yield or “junk” bonds involve a greater risk of default and price volatility and can experience sudden and sharp price swings.
Please consider the charges, risks, expenses, and investment objectives carefully before investing. Please see a prospectus, or, if available, a summary prospectus containing this and other information. Read it carefully before you invest or send money. Investing involves risk, including the possible loss of principal and fluctuation of value.
All indices are unmanaged. You cannot invest directly in an index. Index or benchmark performance presented in this document does not reflect the deduction of advisory fees, transaction charges, and other expenses, which would reduce performance.
This material may not be reproduced in whole or in part in any form, or referred to in any other publication, without express written permission from Smith Capital Investors.
Smith Capital Investors, LLC is a registered investment adviser.
SCI00305