![]()
Dear Friends,
Our expectation around heightened volatility this year is proving to be more extreme in nature and creating a wider band of potential outcomes. Yield curves have flattened, credit spreads have widened and the strong negative sector performance in equities (semiconductors, consumer discretionary, homebuilders, retail, etc.) are all indicators of rising recession risk, or at a minimum, the market getting way in front of the risk.
We referenced the change in monetary policy by the Fed as creating an inflection point for the market and being a source of volatility. Russia’s invasion of Ukraine is fueling heightened geopolitical risk and higher inflation concerns. While it is hard to know how this conflict is going to progress, I am very confident that our thesis of heightened volatility will remain in play for longer than expected.
Our core thesis of a stronger, longer, and more durable recovery is clearly being challenged. I am losing confidence in the thesis in the near term but still believe that the foundations are in place for growth over recession – maybe just slower growth. More concerning is the insidious sticky inflation. Our base case for 2022 was that inflation would prove to be stickier and higher than the consensus forecast. Elevated energy and commodity prices, along with rising wages, are increasing the breadth of inflation and creating greater concerns for investors. We’ve argued in the past that the word ‘stagflation’ was being overused and in many cases used incorrectly, but today, that outcome seems to be part of the growing consensus.
The Fed did not surprise us with its 25bps move, but they continue to be opaque around the balance sheet. Their commentary around following a similar path as the past – but at a faster pace – is hardly inspiring and leaves a good amount of uncertainty on the horizon. I continue to believe the ~9 trillion-dollar balance sheet is a more powerful tool in adjusting negative real rates, but Powell and company seem to think differently. Remember, the Fed’s commentary has been focused on using conventional front rates to adjust policy, putting the balance sheet on the back burner. This, in many ways, could be facilitating the flatter curves we see today. If the curve inverts (we saw 7’s/10s and 5’s/10’s invert this week) the market could quickly jump to the conclusion that a recession is imminent, citing the historical reference that a recession followed 10 of the last 11 times the curve inverted begging the question – why would it be different this time? Right or wrong, the Fed’s complacency around the balance sheet could be the fuel for a significant change in sentiment. The important message from the Fed this week was that growth is going to be slower and inflation is going to be higher – and they stand ready to fight inflation. This is a healthy flip from their position as inflation promoter just a few years ago.
Yield curves tell us a lot about expectations. While we continue to flatten in the United States, other countries are seeing the exact opposite. Note the steepening in German curves. Over the last 3 months the U.S. curve (defined as 2’s/10’s) has flattened 55bps and the German curve has steepened 38bps (03/17/22). The 10yr bund has been under some strong pressure with the heightened inflation concerns around energy prices and other commodities, settling out at positive 38bps (03/17/22).
INSTITUTIONAL INVESTOR USE ONLY
2’s/10’s U.S. Treasury Curve
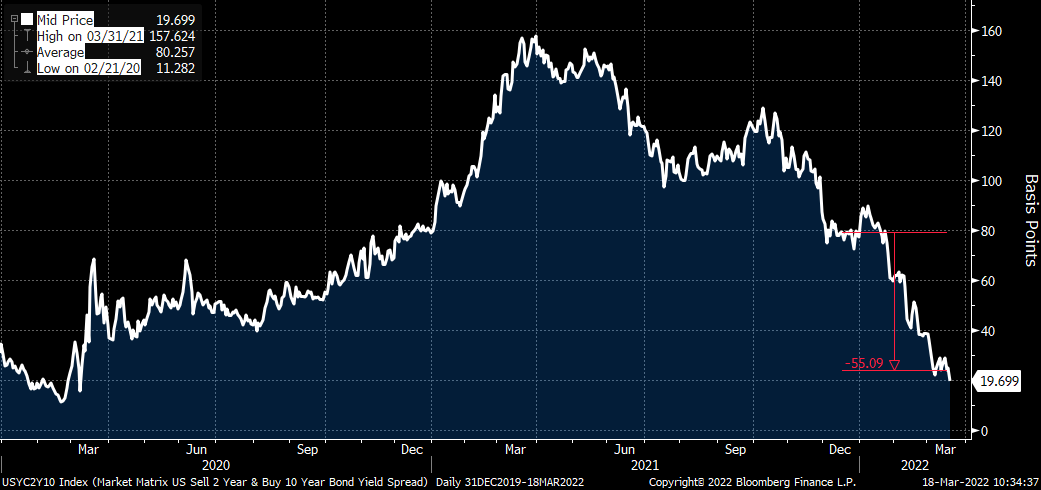
Source: Bloomberg 3/17/22
2’s/10’s German Bond Curve
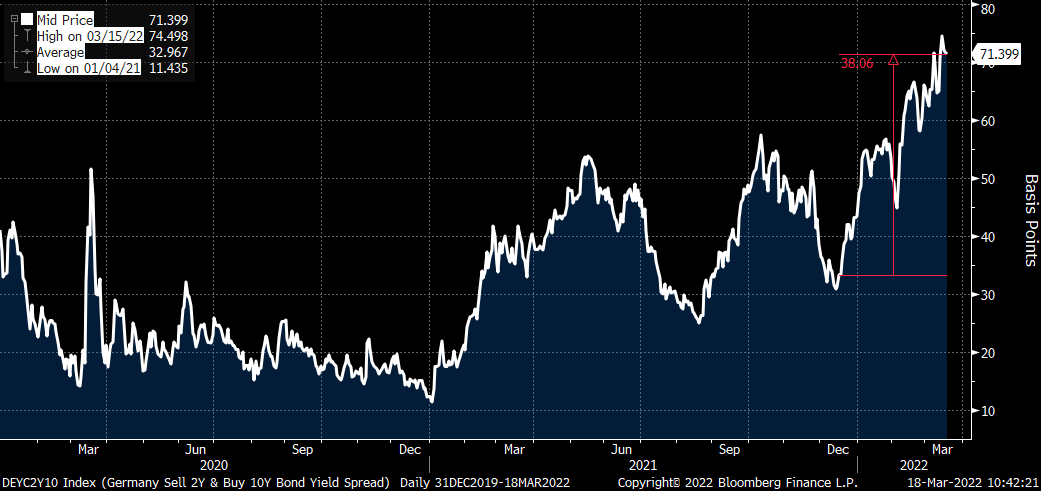
Source: Bloomberg 3/17/22
INSTITUTIONAL INVESTOR USE ONLY
These are interesting and fast markets (speed of capital). The new theme of elevated inflation (longer and more durable) is also something to consider. The breath of inflation is expanding.
With all this said, the markets are quickly discounting what I share above.
2yr U.S. Treasury 133bps higher in yield over the last 3 months
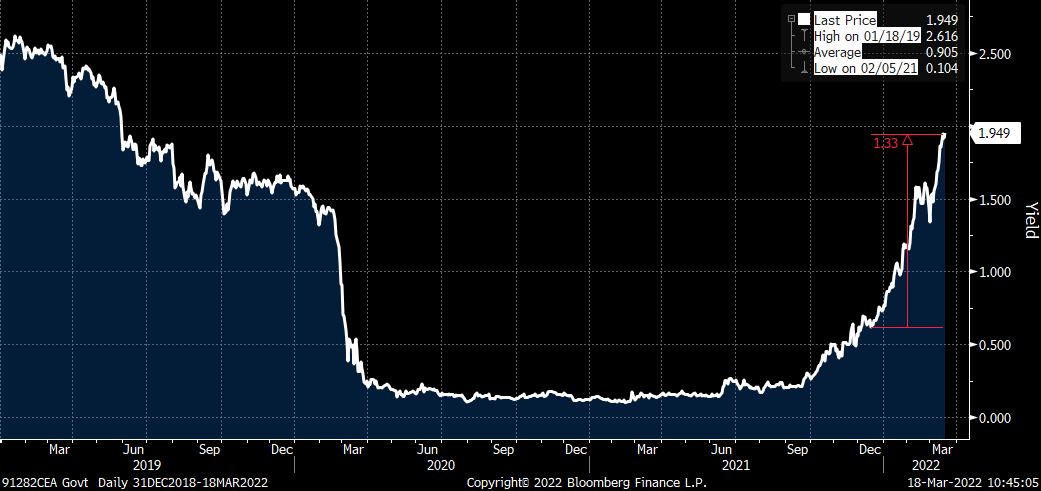
Source: Bloomberg 3/17/22
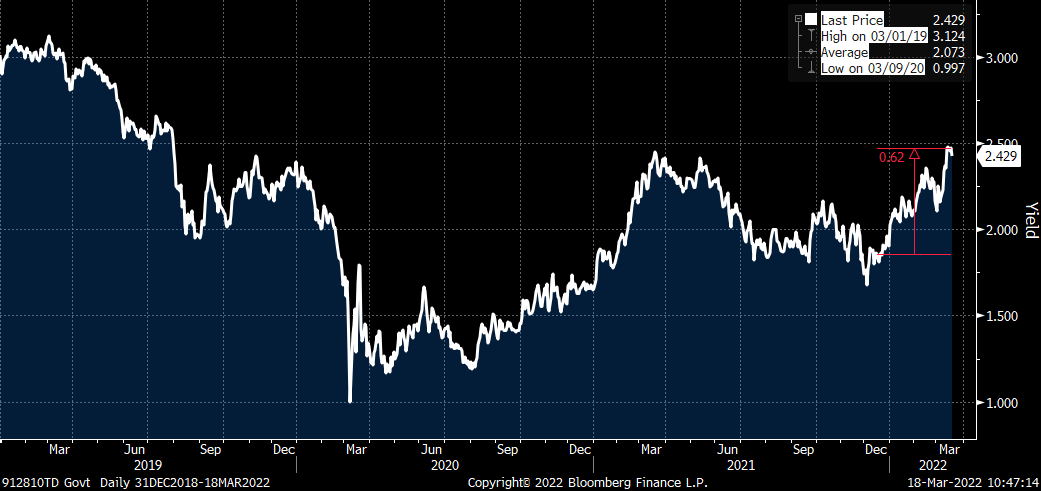
10yr U.S. Treasury 78bps higher over the last 3 month
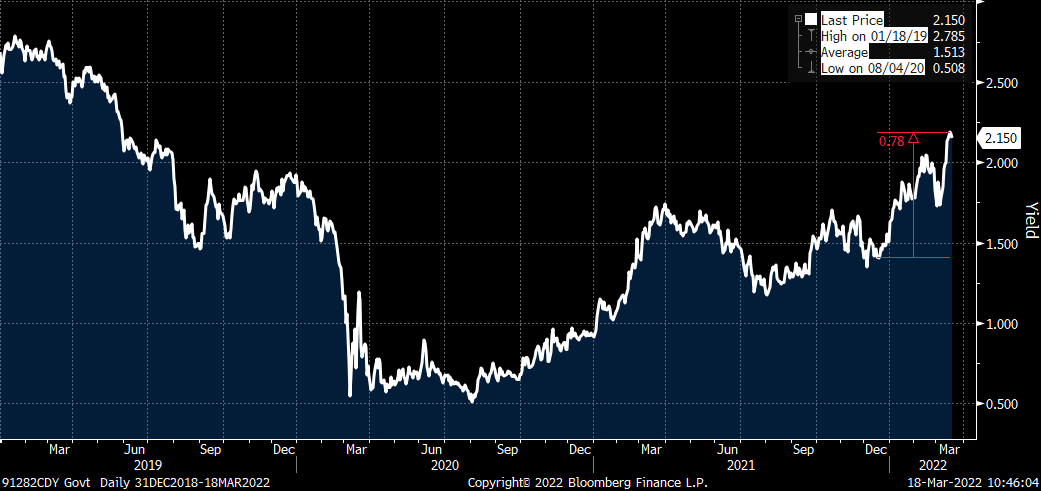
Source: Bloomberg 3/17/22
INSTITUTIONAL INVESTOR USE ONLY
30yr U.S. Treasury 62bps higher over the last 3 months
Source: Bloomberg 3/17/22
At the same time high-yield spreads are 103bps wider YTD, BB’s +84, B’s +102, and BBB’s +49. Based on the buying we are seeing today, by the time you get this they will be tighter.
I am often asked what is keeping me up at night to which I usually respond – having two boys at college and a teenage daughter – but today I worry that heightened volatility will eat at the health of the markets. Violent swings and great uncertainty make it very difficult for capital allocators. We all know that fixed income has been the beneficiary of great flows over the last 5 years, well exceeding most expectations. If high volatility starts to erode investor confidence, I fear that substantial flows out of fixed income (or equities) could trigger a significant repricing of all risk assets and further threaten consumer confidence and sentiment. This, at a time when the Fed is sitting on a ~9 trillion-dollar balance sheet and only 25bps to work with on the front end. The proverbial Fed put option is valued a lot differently today.
We are here to help any way we can, please reach out if you are interested in talking about any of the thoughts or themes I have shared.
With great appreciation,
![]()
Gibson Smith
Let’s talk – Smith Capital Investors
Our mailing address is:
Smith Capital Investors
1430 Blake Street
Denver, CO 80202
303-597-5555
833-577-6484
info@smithcapitalinvestors.com
www.smithcapitalinvestors.com
The opinions and views expressed are as of the date published and are subject to change without notice of any kind and may no longer be true after any date indicated. Information presented herein is for discussion and illustrative purposes only and should not be used or construed as financial, legal, or tax advice, and is not a recommendation or an offer or solicitation to buy, sell or hold any security, investment strategy, or market sector. No forecasts can be guaranteed, and the author and Smith Capital Investors assume no duty to and do not undertake to update forward-looking predictions or statements. Forward-looking predictions or statements are subject to numerous assumptions, risks, and uncertainties, which change over time. Actual results could differ materially from those anticipated in forward-looking predictions or statements.
Any investment or management recommendation in this document is not meant to be impartial investment advice or advice in a fiduciary capacity and is not tailored to the investment needs of any specific individual or category of individuals. Opinions and examples are meant as an illustration of broader themes, are not an indication of trading intent, and are subject to changes at any time due to changes in the market or economic conditions. The information presented herein has been developed internally or obtained from sources believed to be reliable; however, neither the author nor Smith Capital Investors guarantees that the information supplied is accurate, complete, or timely, nor are there any warranties with regards to the results obtained from its use. It is not intended to indicate or imply that any illustration/example mentioned is now or was ever held in any portfolio.
Past performance is no guarantee of future results. As with any investment, there is a risk of loss. Investing in a bond market is subject to risks, including market, interest rate, issuer, credit, inflation, default, and liquidity risk. The bond market is volatile. The value of most bonds and bond strategies are impacted by changes in interest rates. The return of principal is not guaranteed, and prices may decline if an issuer fails to make timely payments or its credit strength weakens. High yield or “junk” bonds involve a greater risk of default and price volatility and can experience sudden and sharp price swings.
Please consider the charges, risks, expenses, and investment objectives carefully before investing. Please see a prospectus, or, if available, a summary prospectus containing this and other information. Read it carefully before you invest or send money. Investing involves risk, including the possible loss of principal and fluctuation of value.
All indices are unmanaged. You cannot invest directly in an index. Index or benchmark performance presented in this document does not reflect the deduction of advisory fees, transaction charges, and other expenses, which would reduce performance.
This material may not be reproduced in whole or in part in any form, or referred to in any other publication, without express written permission from Smith Capital Investors.
Smith Capital Investors, LLC is a registered investment adviser.
SCI00217