Welcome to our mid-year market update.
To view the PDF version, click here.
The first half of 2021 felt like two different markets. The first, from the beginning of the year through the spring, was a full-bore pandemic recovery trade, with very dovish Fed rhetoric, aggressive fiscal spending, a (mostly) successful vaccine rollout, and a return towards economic normalcy. Yields rose, equities rallied, and credit spreads tightened. But by the end of the quarter, that narrative felt a bit long in the tooth, and market dynamics shifted.
As we have written about previously, stock/bond correlations turned positive perhaps demonstrating how dependent risk assets are on easy monetary conditions.
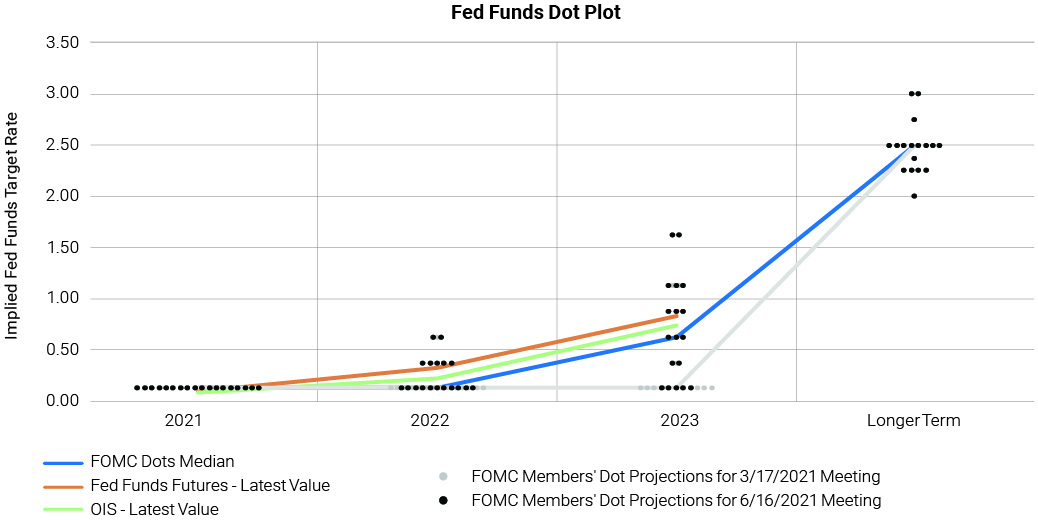
Fiscal seems to be running out of gas, particularly as it relates to the timing and magnitude of infrastructure spending. The pace of credit spread tightening slowed, as valuations hit historic lows and left investors wanting more. And, most importantly, the Fed’s June meeting signaled a significant shift in stance, as the era of ‘easy money forever,’ hopes for higher inflation, and a focus on broader social issues have taken a back seat (at least for now) to a more balanced view. This transition caught the Treasury market off-guard, pushing yields lower and the yield curve flatter.
The Markets have transitioned from a recovery mindset—wherein we were coming out of the pandemic with rising expectations for risk assets and extremely supportive policy—to one where monetary and fiscal support are receding (at least in relative terms), asset prices are extending, and many of the disruptions of the last 18 months seem to be stubbornly slow to normalize.
In this piece, colleagues from around Smith Capital Investors discuss these issues, and more, across Investment Grade and high yield credit, rates and securitized products—highlighting just what an unusual environment we are in. In the coming weeks, we will be out with our latest “5 x 5” piece delving further into many of these themes. Stay tuned.
With great appreciation and gratitude,
The Smith Capital Investors Team
_______________________________________________________________________________________________________________________________________________________________
REVISITING THE FIRST HALF OF 2021
Credit at the Tights
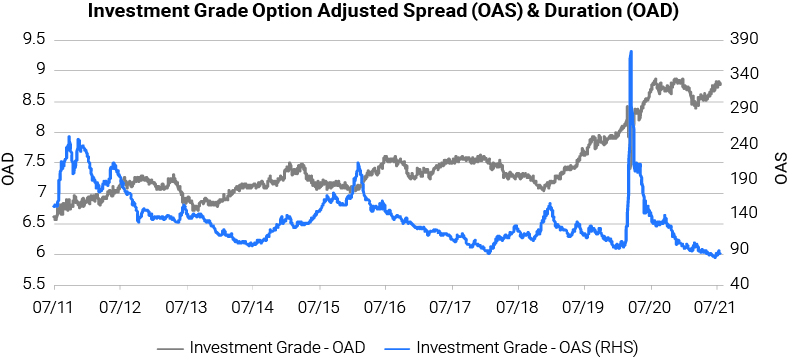
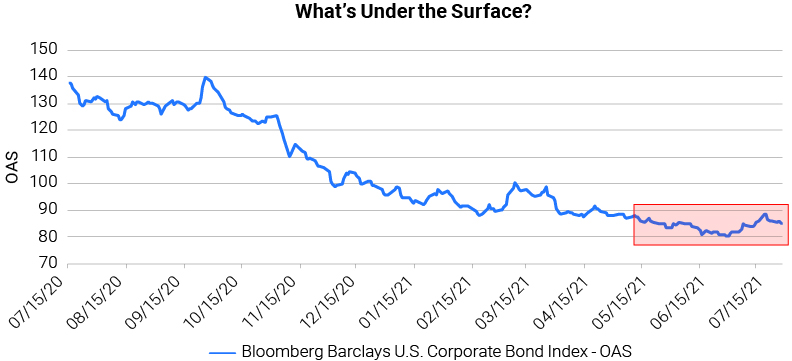
We continue to hover around the 10-year+ tights in Investment Grade credit spread levels. That said, like a stock price alone, absolute spread levels do not necessarily give any insight into actual valuation. While a conversation on valuation can get deep very quickly, ultimately within credit investing, we compare the spread level to the analyzed level of risk, both current and possible.
We attribute spread performance over the last several quarters to three intertwined drivers: stimulus (both monetary and fiscal), economic recovery, and a strong technical backdrop for corporate credit (flows)—all of which influence valuation. While later in this document we will discuss whether we see those drivers continuing going forward, in both the magnitude and direction, let us examine a few of the details described above and how those underlying valuation factors play into spread levels.
- Investment Grade Corporate Credit pays 81 OAS (option-adjusted spread) and 1.85% YTW (yield to worst). BBBs pay 105 OAS and 2.14% YTW. Both OAS and YTW levels are at, or near, decade-plus tights, as of 7/29/21.
- These are levels from the Indices and do not illustrate intra-index changes such as quality (i.e., mix within the Investment Grade ratings band) and duration that tie into valuation. Regarding mix changes over the past decade, we have seen the proportion of low Investment Grade rated companies increase relative to the share of higher-rated companies. This would indicate the index is of lower quality.
- Relative to another crucial input of the risk equation, and therefore valuation of corporate credit, the duration on the Bloomberg Barclays Investment Grade Corporate Credit Index has increased from approximately 6.5 years to nearly 8.8 years over the same 10-year period.
With this tip of the iceberg information, we can confidently say that credit spreads are at historically tight levels, there is a larger mix of lower-rated companies in the Investment Grade Credit Index, and durations have increased. Just with these three elements, it’s easy to make a case that, on an aggregate level, compensation for taking credit risk is low. More simply stated, spread valuations at a high level look rich. Thus, in times like these, where there is little room for error embedded in valuations, security avoidance is of heightened importance.
Source: Bloomberg 7/28/21
High Yield – Low-Quality Leads
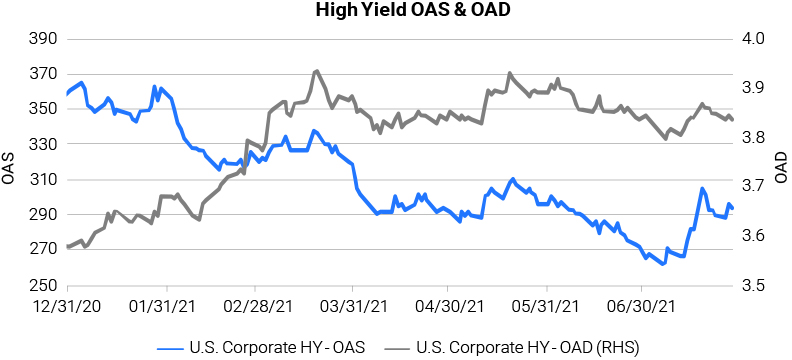
In the first half of 2021, the high yield market saw a continuation of trends that played out in the second half of 2020, namely, spread tightening led by riskier credit, heavy new issuance, and increasing final maturities.
- The option-adjusted spread (OAS) of the Bloomberg Barclays U.S. Corporate High Yield Bond Index (HY Index) tightened from 360 bps on 12/31/20 to 268 bps on 6/30/21, resulting in a total return of 3.62%. Within the Index, CCC-rated bonds led the way, tightening 196 bps and returning 7.20%. As of 6/30/21, the overall Index OAS stood at a 10-year low.
- Primary market issuance remained strong. According to data from J.P. Morgan, year-to-date gross and net high yield issuance of $299B and $100B, respectively, are tracking ahead of last year’s record pace. While refinancing continues to dominate as the preferred use of proceeds, a rise in dividend deals and CCC-rated issuance relative to prior year tallies, signal an increase in investor risk appetite.
- Elevated refinancing volumes have increased final maturities in the high yield market, with the average final maturity at 6.59, as of 6/30/21—consistent with levels last seen in 2014. The option-adjusted duration (OAD) of the HY Index ended Q2 at 3.84, up from 3.58 at the start of the year and from the January 2020 low of 2.96.
While spreads have moved wider in July, fixed income investors have benefited from exposure to high yield credit in 2021. That said, we see several warnings as we survey the current Market. With low spreads, loosening underwriting standards, and increasing duration in a low interest rate environment, the second half of 2021 may provide a bumpier ride for high yield investors.
Source: Bloomberg 7/28/21
INSTITUTIONAL INVESTOR USE ONLY
MBS – Fed is the Only Game in Town
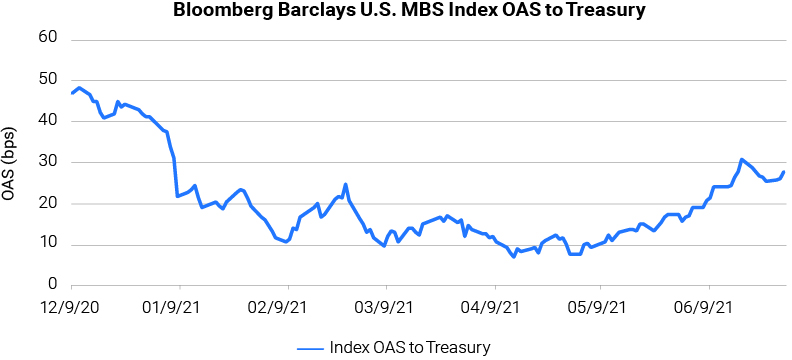
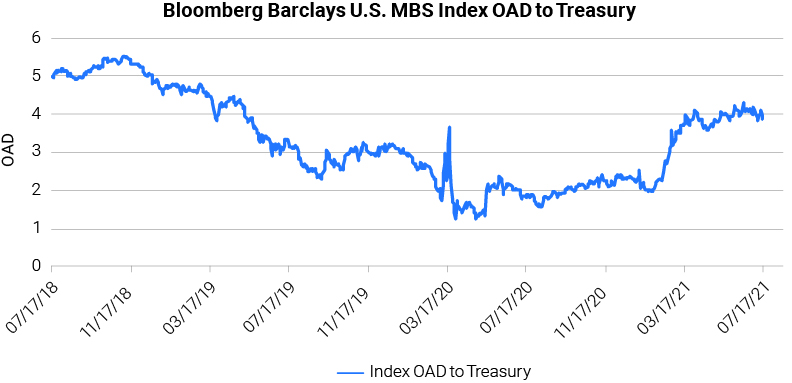
Heading into 2021, the Market was full of commentary about the attractiveness of mortgage-backed securities (MBS). The simplified thesis was two-fold: the Market was coming off very low U.S. Treasury yields (and MBS were short-duration assets), and the asset class still benefited from substantial purchases from the Fed. Both factors were impactful to MBS returns for the first half of 2021.
- The Bloomberg Barclays U.S. MBS Index returned -0.77% in the first half of 2021, outperforming the Bloomberg Barclays U.S. Aggregate Bond Index (Agg) by 83 bps. Performance was entirely driven by the shorter duration nature of the MBS Index vs. the Agg. Excess returns (which adjust for durations differences) for the MBS Index for the first half of 2021 were -45 bps. MBS also underperformed other short duration indices, trailing the Bloomberg Barclays 1-3 Year Credit Index by 98 bps in total returns.
- The biggest story of 1H21 was that Fed purchases of MBS continued to overwhelm supply, especially with a slowdown in refinancing volumes. By the end of April, this had driven the OAS on the MBS index into single digits—compared to a long-term historical average of 40- 50 bps. With this collapse in spreads, we saw a traditional “crowding out effect” whereby money managers, pensions, and even some banks pulled back on MBS buying given the tight valuations—leaving the Fed as the last source of demand.
- Dried-up demand outside of the Fed led to substantial widening in MBS spreads from April lows. By the end of June, spreads widened to ~30 bps as fears around a Fed tapering of MBS purchases in the back half of the year increased.
- This spread widening came on top of a substantial increase in MBS durations—extending from under two years to approximately four years OAD over the period given the move in rates and subsequent decline in refinancings.
Overall, pundit views for MBS coming into 2021 came true. The Fed continued buying massive amounts of the Market and U.S. Treasury yields increased—driving outperformance of short duration assets. However, the MBS index had nuances in performance as speculation around MBS purchase tapering and duration extension from the massive negative convexity of the asset class drove it to underperform vs. the Agg and other short-duration indices.
 Source: Bloomberg 6/30/21
Rates – Cycles Are Getting Shorter
In the first six months of the year, price action from Treasuries provided a little something for everyone. Treasuries are an excellent indicator for future economic expectations, and we have once again lived through a quick mini-cycle.
- U.S. Treasury yields moved higher in a fast and furious manner, starting with the ‘blue wave’ results in January. This was further supported by the efficacy of the vaccine, additional fiscal stimulus, and prospects of economic reopening—all pointing to improving growth and inflation expectations. The street upgraded growth forecasts, inflation expectations rose, and the Market challenged the Fed’s view that they would be able to control inflation.
- March brought us into a narrow trading range for approximately 16 weeks. While the Treasury market waited for validation from the data, we moved between reopening/vaccine enthusiasm and economic data disappointment.
- In June, the Fed’s action was the catalyst to break the 30-year U.S. Treasury out of the long-running range. This, coupled with increased COVID-19 cases from the Delta variant, thin summer volumes, pension buying, a short squeeze, lackluster economic results, global yield differentials, and strong seasonals, quickly approached 30-year yields registered in January 2021.
While we entered 2021 extremely optimistic around the recovery, the Treasury market quickly reminded us that we still live in a two-step forward, one-step back environment. The virus remains a risk, the economy is still fragile, and volatility will remain.
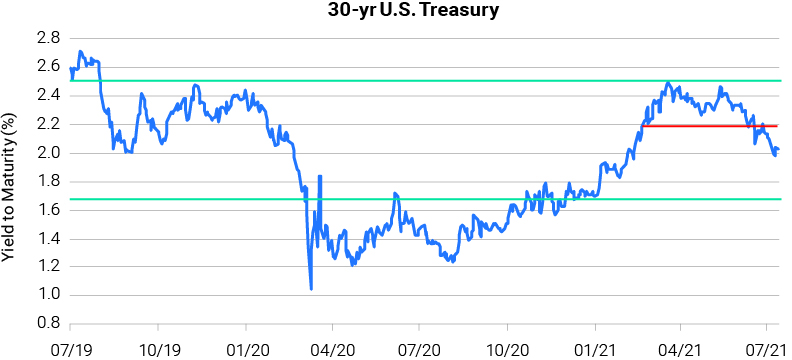
Source: Bloomberg 7/12/21
INSTITUTIONAL INVESTOR USE ONLY
LOOKING TO THE SECOND HALF OF 2021
Credit – Macro Spread Drivers
We believe the three most significant macro spread drivers remain accommodative monetary and fiscal policy, economic recovery, and a strong technical backdrop. Looking ahead, it’s prudent to expect that the unprecedented times and reactions from last year will normalize over time, and the magnitude of these drivers will ebb.
We’ve already begun to witness the first inklings of normalization. And while the pursuit of stability and predictability is often what the Market seeks, our investment process challenges us to maximize our chances at adapting to and taking advantage of an unknown future—volatility. As mentioned, valuations in the Investment Grade credit market currently offer materially diminished compensation for unknowns. And, despite the substantial amount of money still waiting on the sidelines, there is less margin for error when there is less compensation for the unknown. Stakes remain high because basis points in the current fixed income market matter.
In this type of environment, i.e., supportive fundamental picture but likely slowing towards normalization, paired with tight credit spreads and rich valuations, we have found the following items to be of acute importance.
- Risk-Adjusted Carry—in this environment, carry is of elevated importance as we look out over the next six months. But as with most things not all carry is built the same. Fundamental analysis can unearth risk profiles where they may compare more or less favorably when compared to their commensurate carry profiles. This brings us to the intertwined nature of security selection and avoidance.
- Security Selection—under the surface of the Bloomberg Barclays Investment Grade Corporate Credit Index there remains significant opportunity for individual security selection. No matter the inning of the credit cycle or the outlook, there are always outliers created by changing corporate credit risk profiles. We look for those that display a higher probability of improving credit strength.
- Security Avoidance—conversely, active management can purposefully choose to avoid owning certain credits and should do so. A credit that has a higher probability of going through a phase of deteriorating credit strength would be a prime example of a name to avoid.
Risk-adjusted carry and individual security selection and avoidance may not singularly be home runs, but in an environment where the fundamental and technical backdrop are likely to remain supportive, though normalizing, starting spread levels are at or near their historic tights, and valuations leaving little margin for error, singles really matter and add up. For the time being, we believe it is time to smartly hit singles and increase optionality with players on base.
 Source: Barclays 7/28/21
High Yield Outlook – Focus on Active Management
Looking forward, we see several potential positive and negative factors that could drive high yield market returns.
- One positive trend that should continue in the second half of 2021, is the shift into a ratings upgrade cycle following the downgrade cycle that occurred in 2019 and 2020. Ratings upgrade events can be positive catalysts for spread tightening, especially when moving from key technical ratings buckets such as out of CCC or into BBB. For the first half of 2021, J.P. Morgan data shows a rising star/fallen angel dollar volume ratio of 7.4. Outsized rising star volume effectively shrinks the supply of high yield bonds available, a positive technical factor assuming demand stays flat.
- As highlighted in the discussion around elevated refinancing volumes, we expect management teams to continue to be proactive in reducing refinancing risk. With the Bloomberg Barclays U.S. Corporate High Yield Bond Index (HY Index) trading at an average dollar price of 105.22 as of 7/28/21, the opportunity to further reduce interest payments and extend maturities remains. As this theme continues to play out, it could have positive technical implications for the short duration universe.
- On the negative side, we are wary of the potential for earnings disappointment in the back half of the year as companies see inflation in a number of expense line items and year-over-year comparisons get more difficult. We also continue to believe that, as virus-related uncertainty dwindles, we could see a shift in capital allocation away from debt reduction toward more shareholder-friendly activities, which could cause spreads to widen.
While other factors could impact prospective returns (namely the direction of interest rates and the magnitude of inflows or outflows), we believe that investors focused on active management, security selection (and avoidance), and risk-adjusted returns have an opportunity to generate strong outcomes in a highly dynamic market environment.
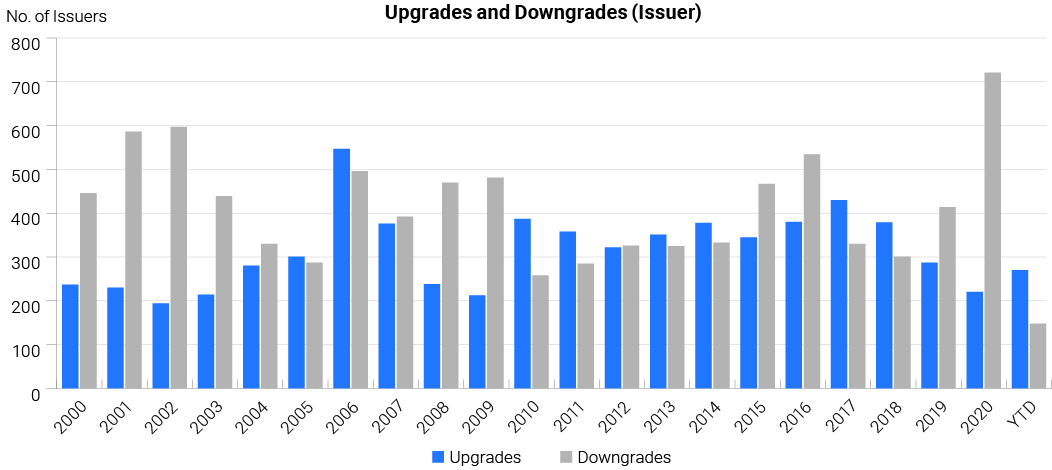
Source: J.P. Morgan; Moody’s Investors Service; S&P, As of July 1, 2021
INSTITUTIONAL INVESTOR USE ONLY
MBS – What Valuation Levels Will Attract Investors?
Talk around the timing of Fed tapering of MBS purchases has continued to gather steam and is probably the most significant factor facing MBS investors for the second half of 2021. We believe that given continued volatility and uncertainty in U.S. Treasury yields, investors need to be aware of the persistent elevated negative convexity that mortgage investors face with both duration extension and contraction posing their own unique potential performance risks.
- The impact of the continued scale of Fed MBS purchases has been a driving factor of MBS spreads and performance. With increased rhetoric from Fed officials surrounding the timing of asset purchase tapering, the Market has started to factor in how this may impact valuations for MBS.
- Through the first half of 2021, significant “crowding out” in MBS occurred with the Fed purchasing more than the net supply, driving spreads tighter and pushing other investors to other asset classes. Historically, MBS OAS has lived in the 40-50 bps range. As the timeline for Fed tapering of MBS purchases becomes more apparent, it will be interesting to see if investors wait for spreads to reach more historically normal levels, or if there will be a rotation back towards MBS before the Market reaches those levels—given historically tight spreads across other fixed income asset classes.
- Another major factor facing MBS investors is the potential for changing durations, and U.S. Treasury yield moves to be a significant driver of returns. Negative convexity (i.e., the sensitivity of MBS durations to changes in U.S. Treasury yields) remains historically elevated. Over the last three years, investors have witnessed the MBS Index duration ranging from 1.2 to 5.5 years.
- Even without large-scale directional changes in U.S. Treasury yields, the current steepness of the Treasury curve means duration will be a major driver of returns. To put this into perspective, the corresponding U.S. Treasury curve for the Bloomberg Barclays U.S. MBS Index durations is currently +85 bps. Importantly, this has ranged between +25 bps and +125 bps over the last year, so even changes in the shape of the U.S. Treasury curve combined with the impact of negative convexity on MBS has the potential to be a significant driver of performance.
We believe that the Market will continue to focus on the timing of any MBS purchase tapering talk from the Fed. Given stretched valuations in other asset classes, we would expect MBS investors to begin to re-engage in the space before we reach historical valuation levels akin to a “reverse crowding out effect.” However, we continue to believe that the underlying story to MBS performance is one of duration and U.S. Treasury curve shape. From a broader portfolio management perspective, we remain concerned about MBS’ continued elevated negative convexity and the potential for this to be a material driver of performance. We will continue with our general practice of evaluating all opportunities both within MBS as well as other sectors on a bond-by-bond basis; searching for securities that provide us with the opportunity to generate superior risk- adjusted returns across a wide range of potential market outcomes.
Source: Bloomberg 7/15/21
Rates – Uncertainty Remains
The first half of the year reminds us that we must remain active in the rates market. Investment cycles are getting shorter, we have watched a collision of factors move the Market dramatically in both directions, and we are frequently reminded that interest rates are a key risk factor in the fixed income market.
- The virus remains present, a factor that remains out of our control, and sentiment moves quickly based on the ebb and flow of the virus case count. Muscle memory quickly reacts to negative virus news; higher cases equal lower yields and vice versa.
- Outright yield levels matter, seasonals are important, pension buying moves the Market, and investor positioning can tip the scales. Throw in global yield differentials and the economic outlook, and once again, we have competing factors.
- The Fed is moving from highly accommodative to marginally less accommodative over time, the stimulus injection is fading, and pandemic benefits are expiring. We are moving past the downturn and subsequent recovery and into normalized economic activity. These elements will impact the shape of the curve as the front-end contends with the Fed removing policy, and the long-end reflects growth and inflation expectations.
As we look to the end of the year, we believe competing factors will keep volatility high in the interest rate market. Fear, volatility, and seasonals will be with us until Labor Day. Our attention will then turn to the Fed’s dual mandate—inflation and employment—and commentary around tapering. General market sentiment, reopening activity, and the virus will continue to create market volatility, as will headlines out of Washington. We are not lacking for event-driven risk over the next six months, and we see the possibility of both positive and negative catalysts in the marketplace. One thing is clear – the bond market reminds us that uncertainty remains.
Source: Barclays 7/15/21
INSTITUTIONAL INVESTOR USE ONLY
Strategy – Well, This Is Different
Almost every active professional investor in today’s markets has lived through an era of low and declining inflation and interest rates. And while external shocks of many a variety have provided moments of volatility over the years, 18 months (and counting) of a global pandemic is something beyond the norm as well. Market outcomes over the balance of the year will be driven by factors that remain unique to today’s environment.
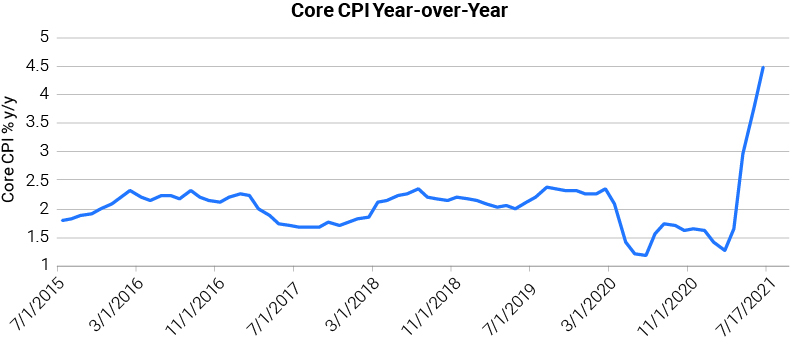
For the first time in decades, the inflation watch is going to be a very real thing. Will the headline levels persist? Will there be an expansion from the narrow set of categories or an expansion into other goods and services? Will wage gains continue and expand? Will these factors shift forward expectations? Will supply bottlenecks and shifting labor dynamics drive inflation, production, corporate margin outcomes, or ease back to normal? Are investors underappreciating the vulnerability of a heavily indebted economy to outside shocks or higher interest rates?
This is a very unusual environment for investors. Inflation headlines and rhetoric have been proliferating for months, and (for now) the bond and stock markets have reacted benignly. That feels a bit cavalier. And disruptions to supply chains and the labor market may indeed prove transitory as well, to invoke that overused word. Still, the potential impact on corporate revenues, margins, and strategies may well prove quite meaningful–all of which portends an interesting and potentially volatile second half to the year.
Source: Bloomberg 6/30/21
Let’s Talk – Smith Capital Investors
Our mailing address is:
Smith Capital Investors
1430 Blake Street
Denver, Colorado 80202
303-597-5555
833-577-6484
info@smithcapitalinvestors.com
The opinions and views expressed are as of the date published and are subject to change without notice of any kind and may no longer be true after any date indicated. Information presented herein is for discussion and illustrative purposes only and should not be used or construed as financial, legal, or tax advice, and is not a recommendation or an offer or solicitation to buy, sell or hold any security, investment strategy, or market sector. No forecasts can be guaranteed, and the author and Smith Capital Investors assume no duty to and do not undertake to update forward-looking predictions or statements. Forward-looking predictions or statements are subject to numerous assumptions, risks, and uncertainties, which change over time. Actual results could differ materially from those anticipated in forward-looking predictions or statements.
Any investment or management recommendation in this document is not meant to be impartial investment advice or advice in a fiduciary capacity and is not tailored to the investment needs of any specific individual or category of individuals. Opinions and examples are meant as an illustration of broader themes, are not an indication of trading intent, and are subject to changes at any time due to changes in the Market or economic conditions. The information presented herein has been developed internally or obtained from sources believed to be reliable; however, neither the author nor Smith Capital Investors guarantees that the information supplied is accurate, complete, or timely, nor are there any warranties with regards to the results obtained from its use. It is not intended to indicate or imply that any illustration/example mentioned is now or was ever held in any portfolio.
Past performance is no guarantee of future results. As with any investment, there is a risk of loss. Investing in a bond market is subject to risks, including Market, interest rate, issuer, credit, inflation, default, and liquidity risk. The bond market is volatile. The value of most bonds and bond strategies are impacted by changes in interest rates. The return of principal is not guaranteed, and prices may decline if an issuer fails to make timely payments or its credit strength weakens. High yield or “ junk” bonds involve a greater risk of default and price volatility and can experience sudden and sharp price swings.
Please consider the charges, risks, expenses, and investment objectives carefully before investing. Please see a prospectus, or, if available, a summary prospectus containing this and other information. Read it carefully before you invest or send money. Investing involves risk, including the possible loss of principal and fluctuation of value.
All indices are unmanaged. You cannot invest directly in an index. Index or benchmark performance presented in this document does not reflect the deduction of advisory fees, transaction charges, and other expenses, which would reduce performance.
This material may not be reproduced in whole or in part in any form, or referred to in any other publication, without express written permission from Smith Capital Investors.
Smith Capital Investors, LLC is a registered investment adviser.
SC100166.
INSTITUTIONAL INVESTOR USE ONLY